
How Singapore Businesses Can Improve Audience Engagement with Digital Displays
Attention is the scarcest commodity in any Singapore retail, office, or public space. A static sign competes for attention against every other stimulus in the environment. A well-designed digital display doesn't just compete — it wins, because it can adapt in real time, respond to context, and earn attention with motion and relevance. This article explains why engagement matters, where digital displays work best, the content that captures attention, design principles that drive response, the metrics to track, and Singapore-specific industry examples.
Why Engagement Matters
Most digital display installations fail the engagement test. The screens are on. The content is looping. The vendor got paid. And almost nobody is paying attention.
This happens because visibility is not engagement. A display that 10,000 people pass per day is not the same as a display that 10,000 people actually look at. The Singapore retail data is sobering: the average digital signage display holds attention for less than 5 seconds, and 60% of passers-by report not noticing it at all.
Engagement matters because the whole economic case for digital displays rests on it. A display that nobody notices costs the same as a display that drives 10x the footfall into a store. The hardware is fixed; the value comes from the content and design that earns attention.
Where Digital Displays Work Best
Digital displays earn engagement when they are placed where the audience is already attentive, when the content is relevant to the moment, and when the design rewards looking. The contexts that work:
Points of decision. In front of a menu, at a queue, at a turnstile, in a fitting room. The audience is already making a decision; the display can help them make it.
Points of waiting. Lift lobbies, queue areas, reception desks, transit platforms. The audience has time and is looking for distraction. The display can supply useful distraction — relevant news, the meeting room they're heading to, the queue they're in.
Points of arrival. Airports, train stations, hotel lobbies, building entrances. The audience is arriving, looking for orientation. The display can give them directions, a welcome message, the schedule for the day.
Points of transaction. At the POS, at the self-checkout, in the fitting room mirror. The audience is about to spend money or has just done so. The display can cross-sell, confirm loyalty, or invite a review.
What doesn't work as well: displays in transit corridors, in stairwells, or in any place the audience is moving through quickly. These screens become ambient wallpaper — on, but not really seen.
Content That Captures Attention
Five types of content consistently outperform generic brand loops:
- Contextual content — changes by time of day, weather, current promotion. A coffee shop showing iced drinks when it's 32°C and humid gets a different response than a coffee shop showing the same espresso ad all day.
- Live data — news headlines, transit times, queue lengths, today's meetings. Anything that changes and is relevant to the audience.
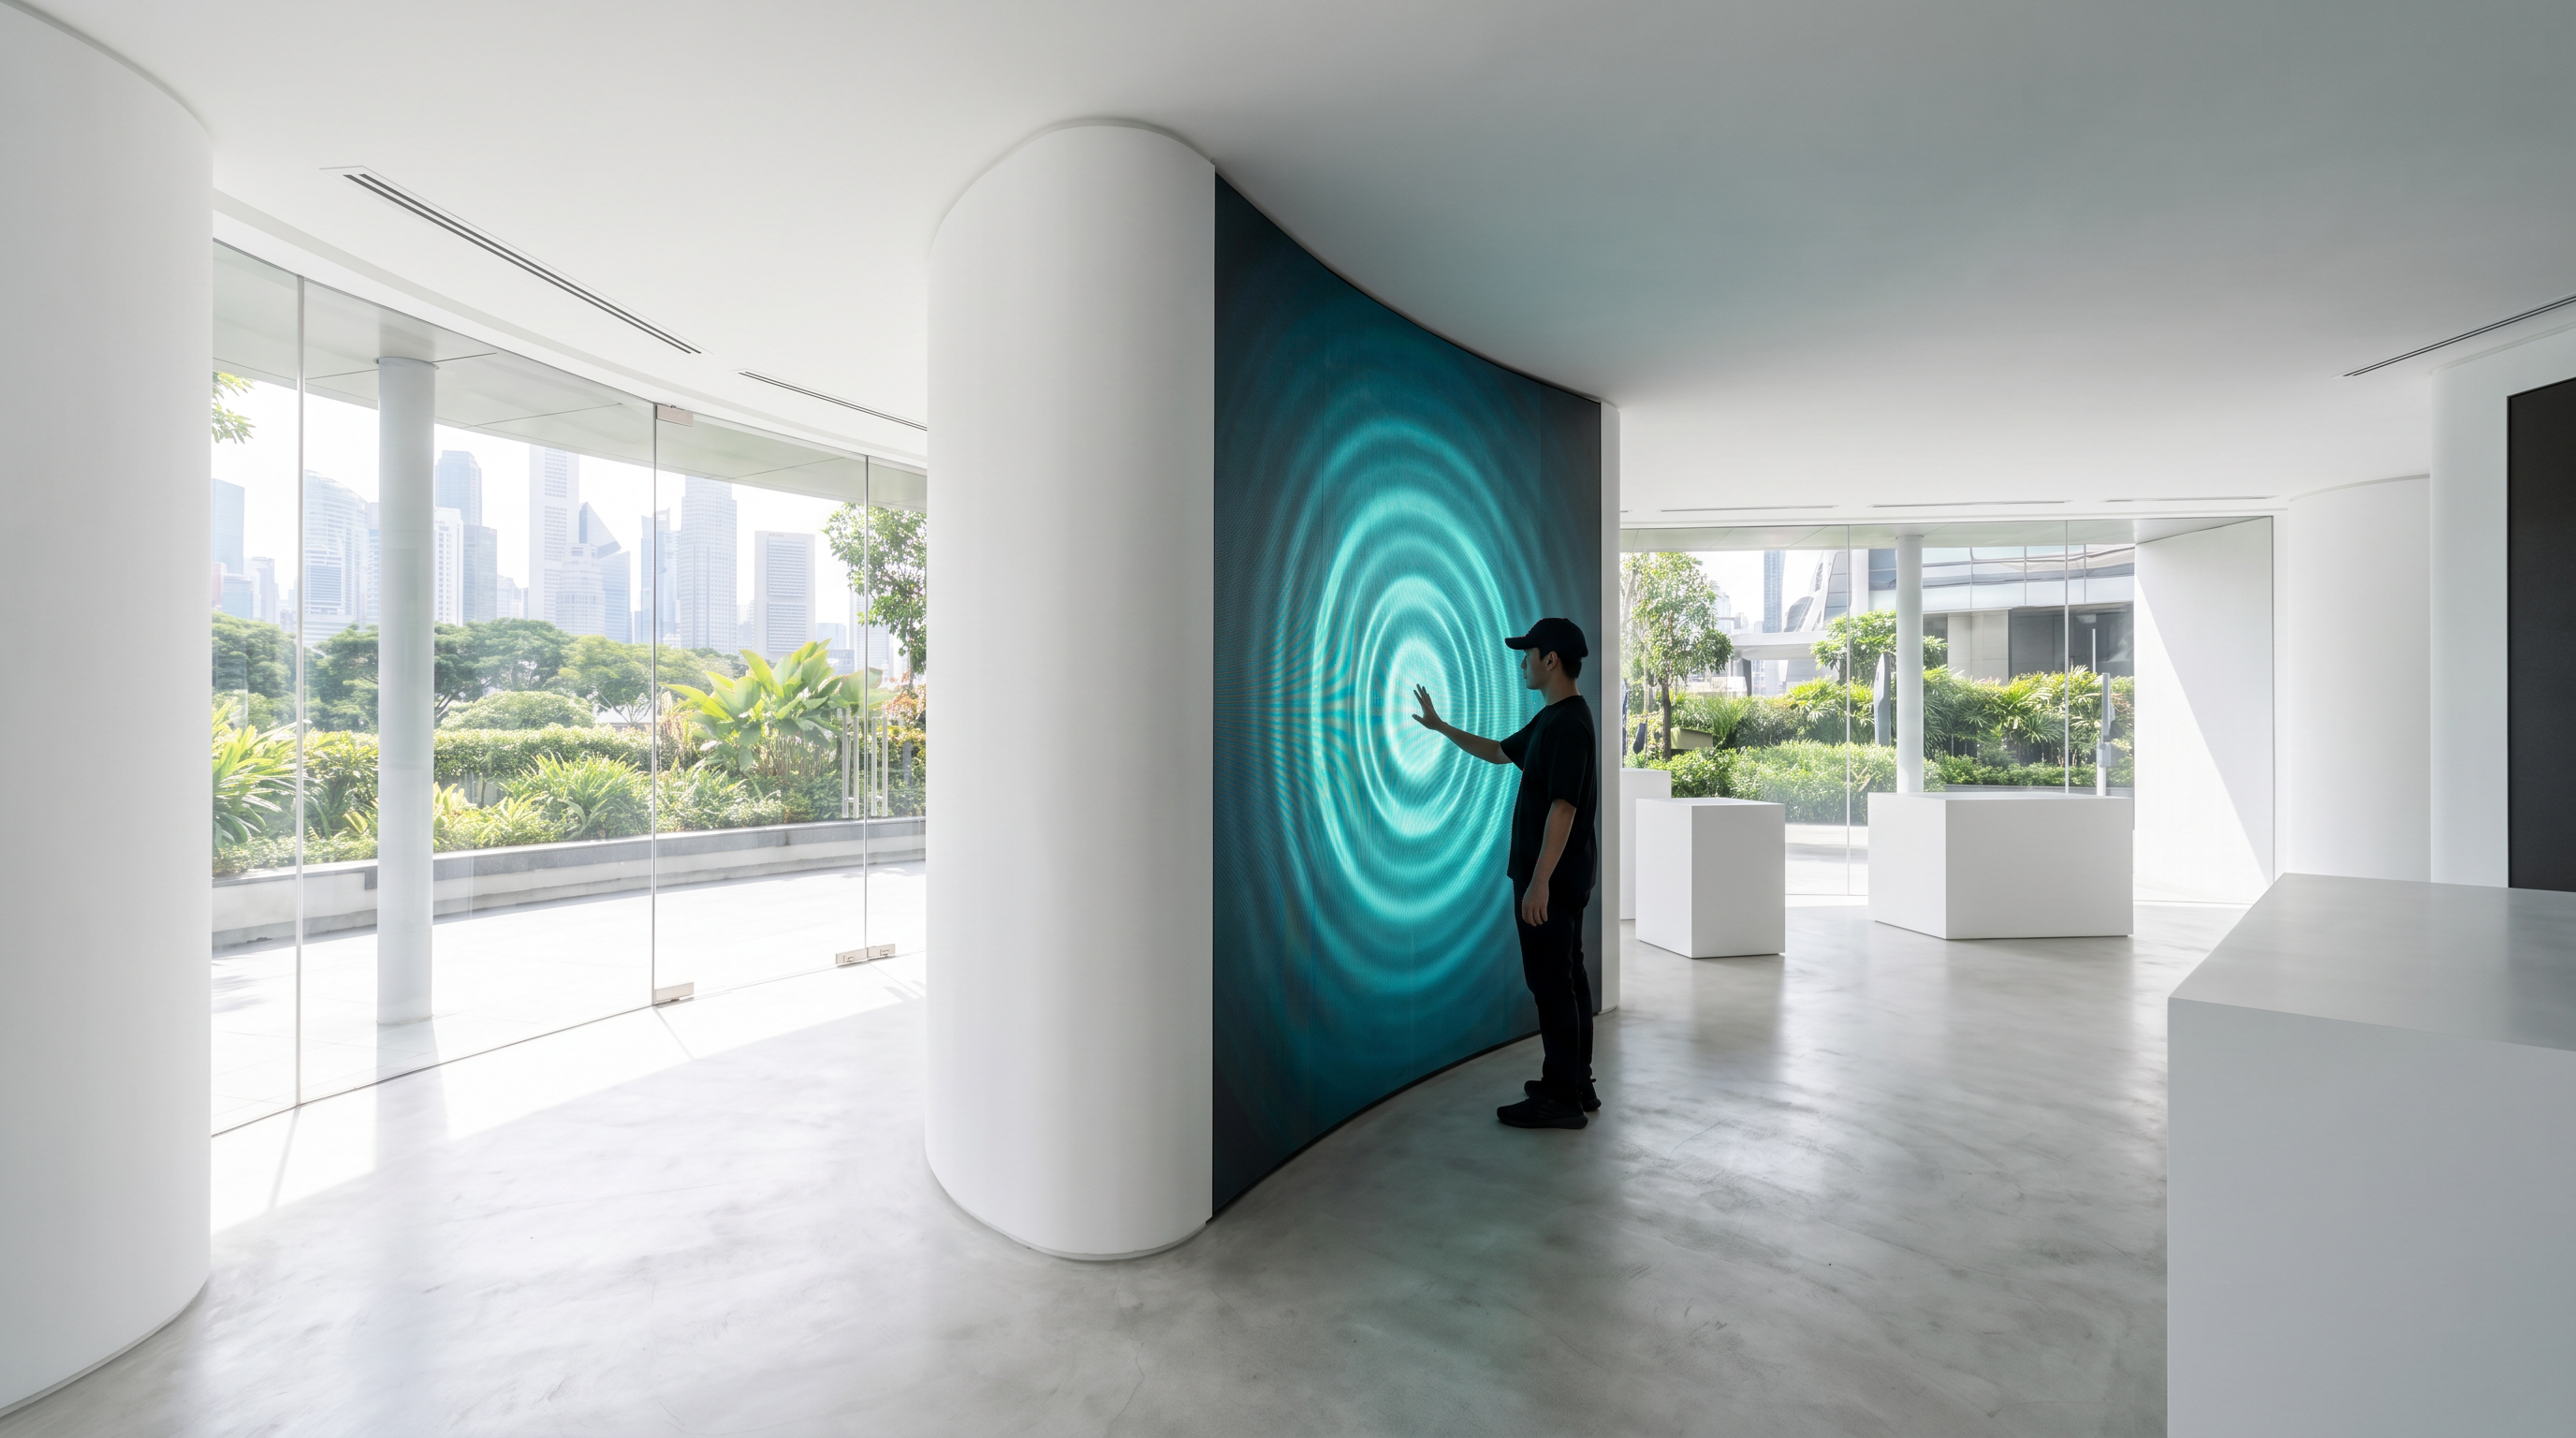
- Interactive — touch-driven menus, quizzes, product configurators, wayfinding. Engagement is implicit in the interaction.
- Social proof — live customer reviews, social media feeds, "as seen in" logos. Taps into trust signals the audience values.
- Personalised — face-detect, RFID tap, or app-based recognition that swaps content based on who's looking. The premium tier of digital signage; the highest engagement too.
Design Principles for Better Response
Three design rules that separate displays that earn attention from displays that get ignored:
1. The 3-second test. A passer-by gives the display 3 seconds of attention, max. Within those 3 seconds, the message must be clear, the brand must be obvious, and the next action must be obvious. If any of those take longer than 3 seconds to land, simplify.
2. Motion with purpose. Motion attracts the eye. Use it to draw attention to the message, not to show off the screen's refresh rate. One or two elements in motion is more effective than eight.
3. High contrast, large type, simple layout. Public-facing displays are often viewed in imperfect conditions — bright sunlight, awkward angles, brief attention. The safest design language: large type (at least 5% of the screen height for primary text), high contrast (light text on dark background, or vice versa), and one primary message per screen.
Metrics to Track Performance
Measure engagement, not just uptime. Five metrics, from simple to advanced:
1. Estimated impressions. Foot traffic in the venue × percentage of people facing the screen. Quick to calculate, useful as a baseline.
2. Dwell time. Measured by integrated cameras or proximity sensors. Tells you whether the display is actually being looked at. Anything over 3 seconds counts as a real view.
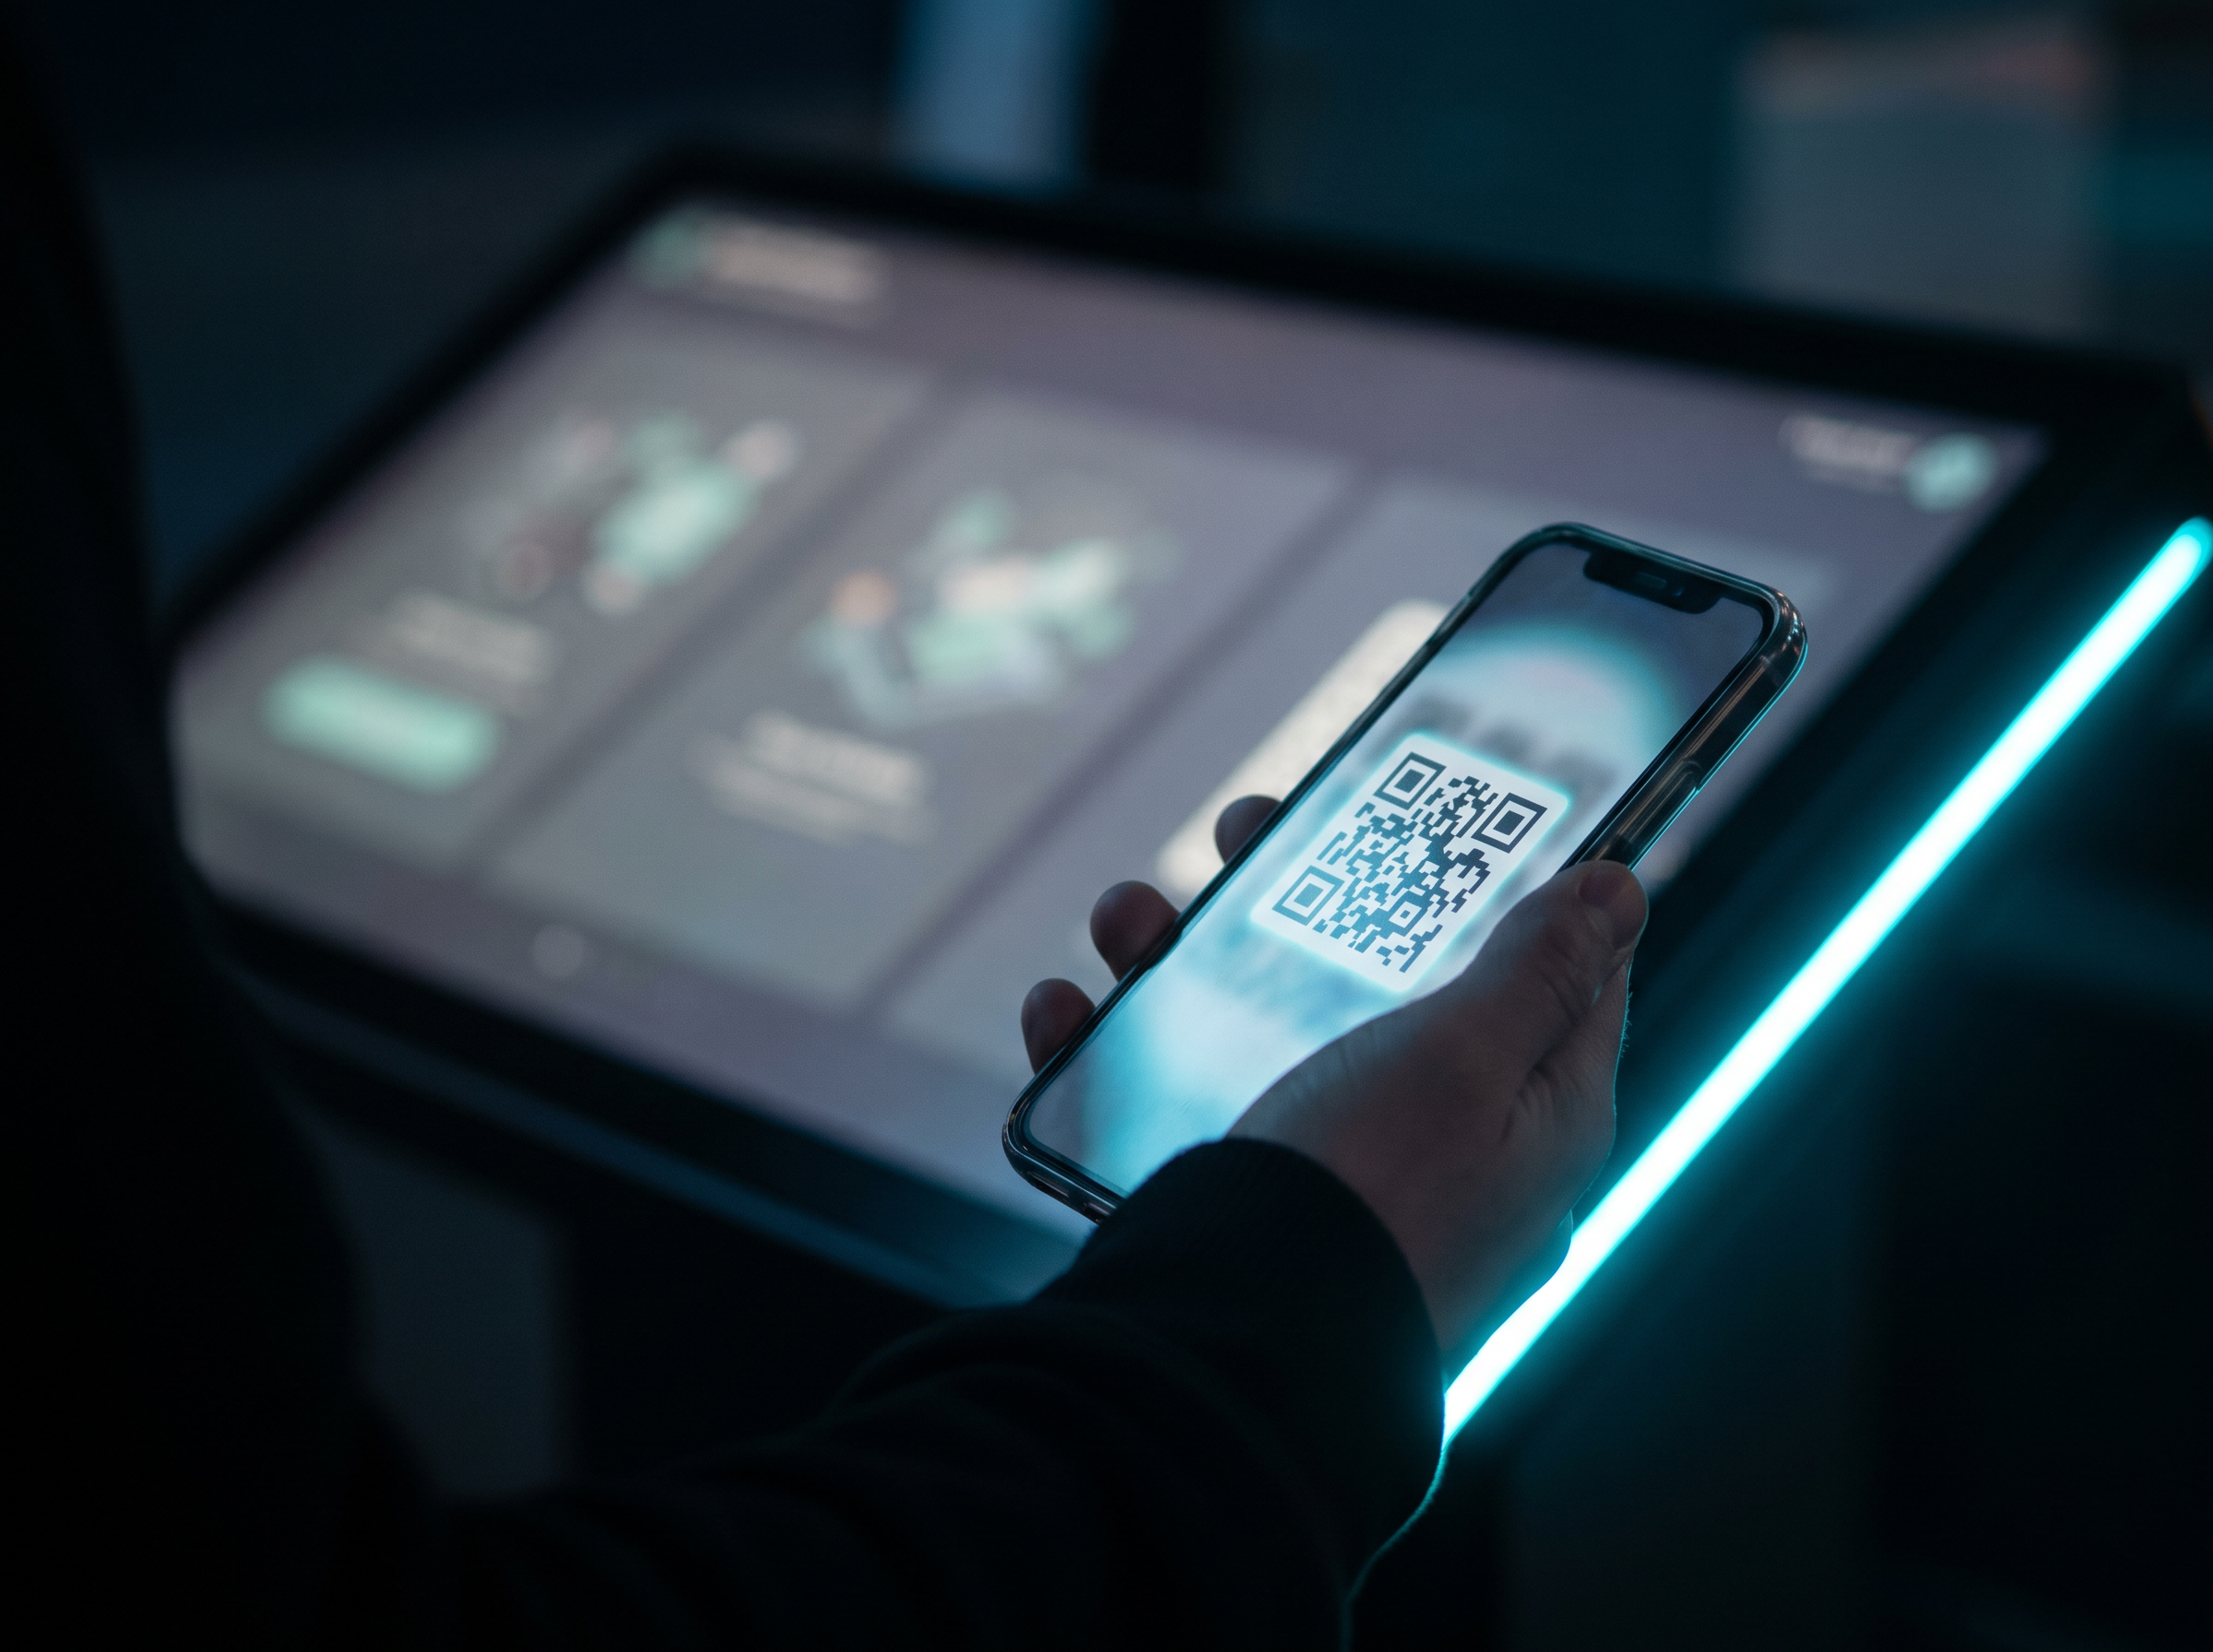
3. Interaction rate. For touch displays: touches per session, time per session, screens visited per session. For non-touch: QR scans from the screen.
4. Conversion attribution. Tie display exposure to in-store conversion (using beacons, Wi-Fi presence, or unique promo codes). This is the metric that justifies the entire investment.
5. Sentiment. Survey the audience. The most direct measure of whether the display is doing its job.
Industry Examples in Singapore
Three quick examples of where we've seen engagement work in Singapore:
Retail — VivoCity fashion tenant. Replaced a printed window display with a contextual digital display showing different content by time of day. Morning: workwear. Lunch: casual. Evening: occasion. Dwell time went from 2.1 seconds (static) to 6.8 seconds (digital). Footfall into the store up 23%.
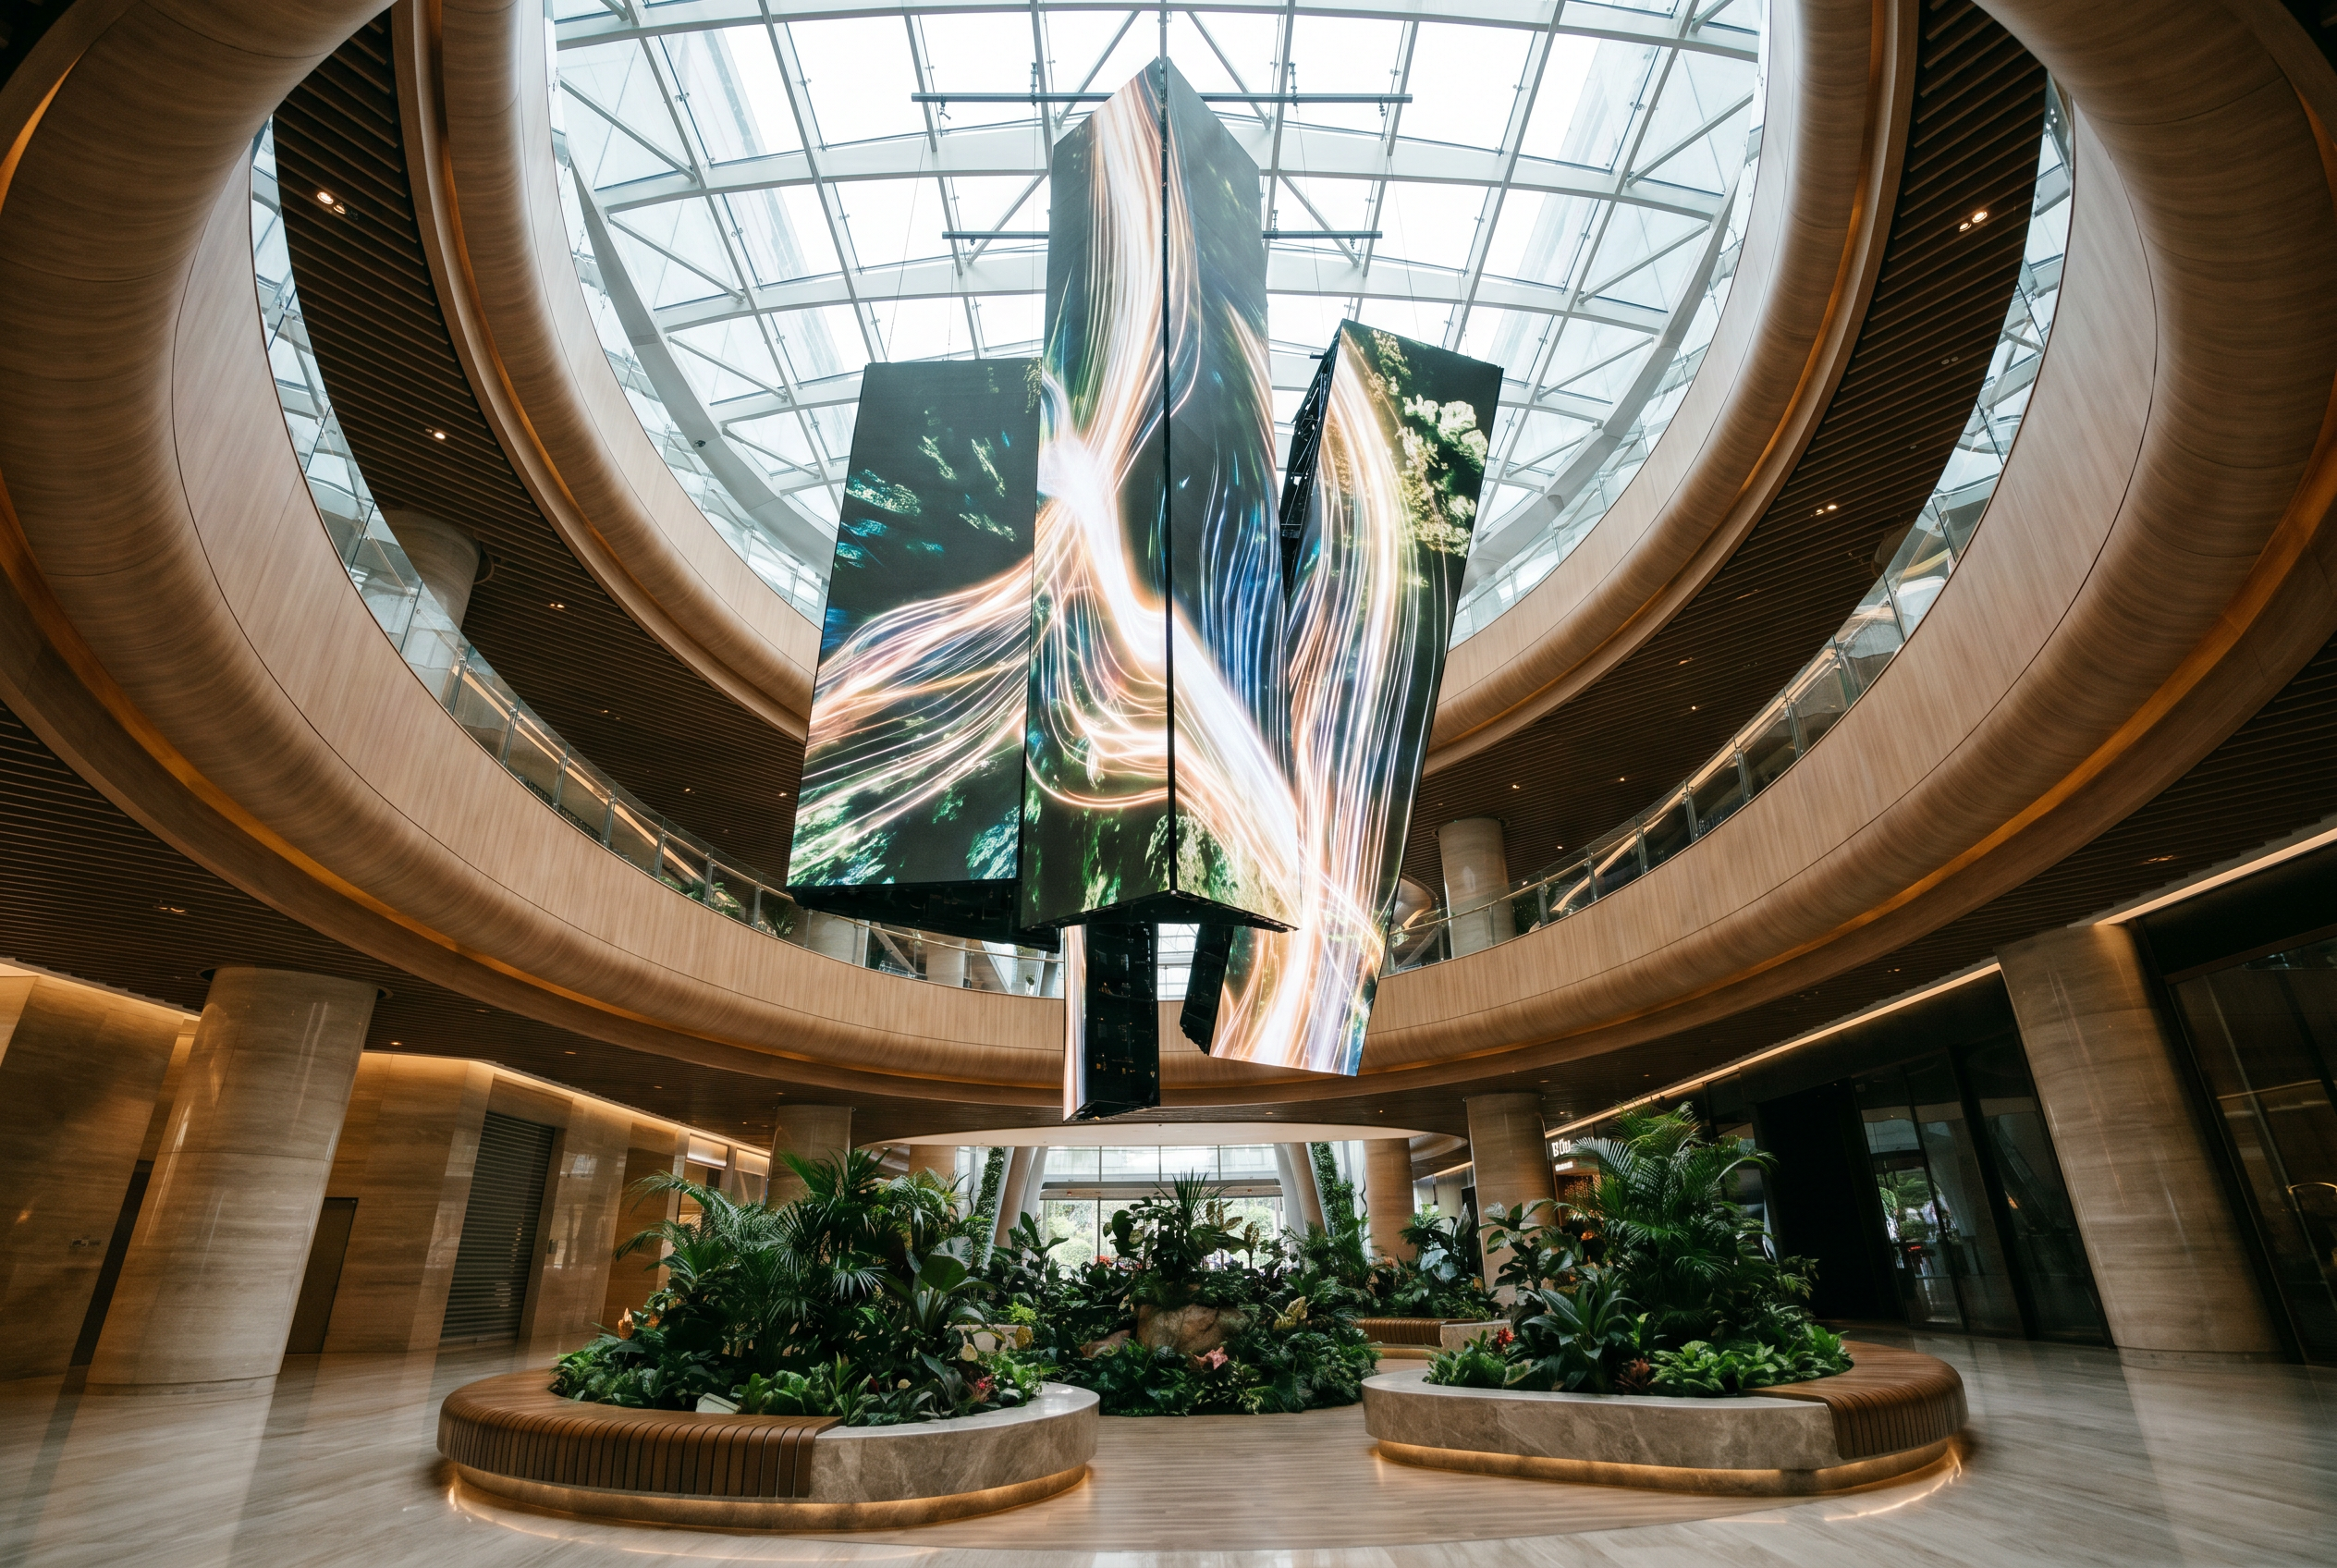
Corporate — Marina Bay office tower lobby. Replaced a static welcome board with a 65" display showing today's weather, the day's events in the building, and the nearest coffee. Average dwell time in the lobby went from 4 seconds to 11 seconds. Tenant satisfaction surveys improved measurably within 3 months.
Quick-service restaurant — multiple outlets. Replaced printed menu boards with dayparted digital menu boards. Morning items automatically swap to lunch at 11am, dinner at 5pm. Combo attach rate up 19% on average, biggest uplift in the breakfast daypart where the printed board had been out of date since 2019.
Want to measure what your current displays are doing? Versal Media runs free engagement audits — we benchmark your current screens against similar deployments in your industry and produce a written improvement plan. Book a 30-minute consultation to start.
FAQ
How much more attention do digital displays get vs static signs?
What's the difference between attention and engagement?
How do I measure engagement?
How often should I refresh the content?
Does animation really help, or is it just decoration?
Can digital displays work for B2B audiences, or only consumer?
Have a project in mind?
We’ll send a clear quote in one business day.
Tell us your space, audience and goal. We’ll recommend the right setup — hardware, software and content — and turn around a fixed-scope proposal.